The Health and Safety Executive (HSE) has today released its annual figures for work related fatalities.
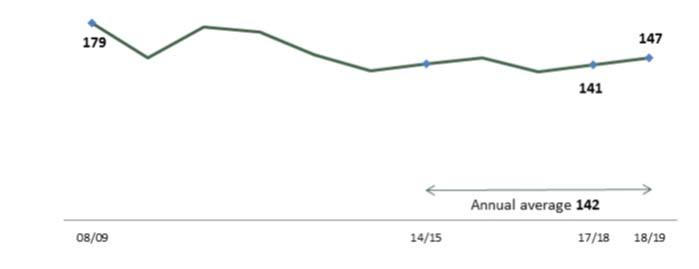
The provisional annual data for work-related fatal injuries revealed that 147 workers were fatally injured between April 2018 and March 2019 (a rate of 0.45 per 100,000 workers).
There has been a long-term reduction in the number of fatalities since 1981. Although 2018/19 saw an increase of 6 workplace fatalities from 2017/18, the number has remained broadly level in recent years.
So, this week I thought that I would look at these statistics and you can see how your industry is doing
Fatal injuries to workers
Headline figures:
A total of 147 workers were killed at work in Great Britain in 2018/19. Although this represents an increase of 6 fatalities from 2017/18, it is possible that this change can be explained by natural variation in the figures.
In statistical terms the number of fatalities has remained broadly level in recent years – the average annual number of workers killed at work over the five years 2014/15-2018/19 is 142.
Figure 1: Fatal injuries to workers: GB 2008/09 – 2018/19
This report provides headline numbers on workplace fatal injuries that were reported to enforcing authorities in 2018/19. It includes both fatal injuries to workers and to members of the public. The 2018/19 figures are currently provisional and will be finalised in July 2020 to take account of any necessary adjustments. In tables and chart headings, 2018/19 is marked as ‘p’ for clarity.
Fatal injuries are thankfully rare events. There is a degree of chance and randomness to the annual count resulting in an element of natural variation from one year’s count to the next. To allow for this natural variation, alongside figures for 2018/19, this report also presents the annual average estimate for the five years 2014/15-2018/19, which reduces the effect of year-on-year fluctuations and gives a more stable current picture.
The figures make up part of a long running series enabling both short and long-term comparisons of change. The information includes only those cases of fatal injury that the enforcing authorities have judged as meeting the reporting criteria as set out in the Reporting of Injuries, Diseases and Dangerous Occurrences
Regulations (RIDDOR). Two notable exclusions from these statistics are fatal diseases and fatal accidents on non-rail transport systems.
Injuries by industry
There are two ways of looking at fatality numbers.
The first is to look at the absolute count. On this basis, Construction and Agriculture, forestry and fishing tend to come out worst as they account for the greatest number of fatalities each year.
Figure 2: Number of fatal injuries by main industry group, 2018/19p and annual average for 2014/15-2018/19
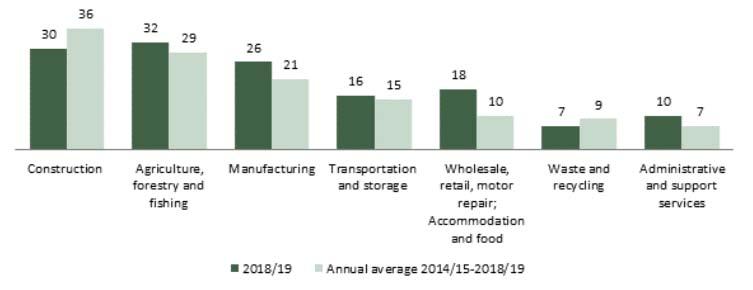
The number of fatal injuries in 2018/19 for each of the main industry sectors is broadly in line with the annual average over the last five years. However, numbers can be prone to year-on-year fluctuations.
- The number of fatal injuries to workers in Construction in 2018/19 (30) is the lowest number on record, a similar number to the previous low in 2016/17 (31). However, the number has fluctuated over the last five years ranging between 30 and 47 (in 2015/16).
- The number of fatal injuries in Manufacturing has fluctuated over the last five years, and the number in 2018/19 is up on the low of 15 in 2017/18.
- Of the 18 deaths in Wholesale, retail trade, motor vehicle repair; Accommodation and food service
- 7 were in Wholesale and retail trade of motor vehicles (including motor vehicle repair)
- 8 were in other Wholesale trade activities;
- 2 were in Retail trade
- 1 was in Accommodation.
- Although not shown in Figure 2, there were 8 fatal injury cases in other sectors in 2018/19, including 4 in public services (comprising Public administration; Education; Human health and social work activities).
The second approach of looking at fatality numbers is to consider the fatal injury rate in terms of the number of fatalities per 100,000 workers employed.
Figure 3: Rate of fatal injuries by selected main industry group (per 100,000 workers), 2018/19 and annual average for 2014/15-2018/19
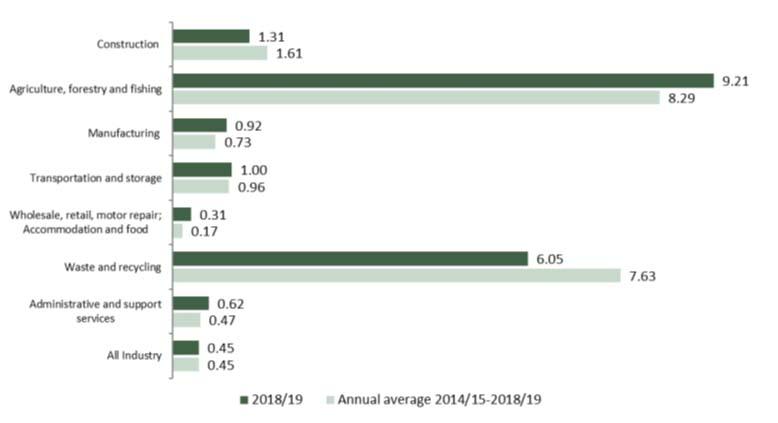
Based on the annual average rates for 2014/15-2018/19 (as this reduces the effect of year-on-year fluctuations and gives a more stable picture):
- Agriculture, forestry and fishing and Waste and recycling come out worst, with a rate of injury some 18 times and 17 times as high as the average across all industries respectively.
- The rate of fatal injury in Construction, while around 4 times as high as the average rate across all industries, is considerably less than the rate in either Agriculture, forestry and fishing or Waste and recycling, despite accounting for a greater number of cases than these sectors.
- The Manufacturing and the Transportation and storage sector have a rate of fatal injury around 1.5 to 2 times the average rate across all industries.
- Although not shown in figure 3 above, the rate of fatal injury in Mining and quarrying is around four times as high as the average rate across all industries and broadly similar to that seen in construction.
- While the combined ‘Wholesale, retail, motor repair; Accommodation and food services’ sector account for around 7% of fatal injuries between 2014/15 and 2018/19, in terms of rate the overall sector is relatively low risk with an injury rate of around one third the all industry rate. However, there will be variation in risk across activities within the sector.
Injuries by accident kind
Around three-quarters of fatal injuries in both 2018/19 and the combined five-year period 2014/15-2018/19 were accounted for by just five different accident kinds (see figure 4 below). Falls from a height, being struck by a moving vehicle and being struck by a moving, including flying or falling, object continue as the three main causes of fatal injury, between them accounting for over half of all fatal injuries each year since at least 2001/02.
Figure 4: Number of fatal injuries to workers by accident kind, 2018/19p and annual average for 2014/15- 2018/19
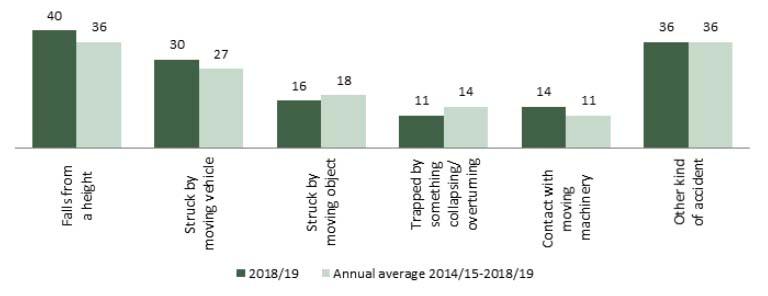
- In 2018/19, 40 fatal injuries to workers were due to falls from a height. This compares to 35 in 2017/18 and an annual average over the period 2014/15-2018/19 of 36.
- Being struck by a moving vehicle accounted for 30 fatal injuries to workers in 2018/19 compared with 24 in 2017/18 and an annual average of 27 over the period 2014/15-2018/19.
- The number of fatal injuries caused by being struck by a moving, including flying or falling, object has fluctuated between 15 and 23 over the last five years, with an annual average of 18 over the period 2013/14-2018/19.
- The 36 fatal injury cases in the Other kind of accident category in 2018/19 are made up of a range of different accident kinds including (but not limited to):
- Injured by an animal (8)
- Drowning or asphyxiation; Exposed to explosion; Contact with electricity or electrical discharge; (5,5,4 fatalities respectively).
Injuries by gender and age
Fatal injuries to workers are predominately to male workers. In 2018/19, 139 (95%) of all worker fatalities were to male workers, a similar proportion to earlier years.
In terms of age, 25% of fatal injuries in 2018/19 were to workers aged 60 and over, even though such workers made up only around 10% of the workforce.
Figure 5: Number of fatal injuries by age group, 2018/19
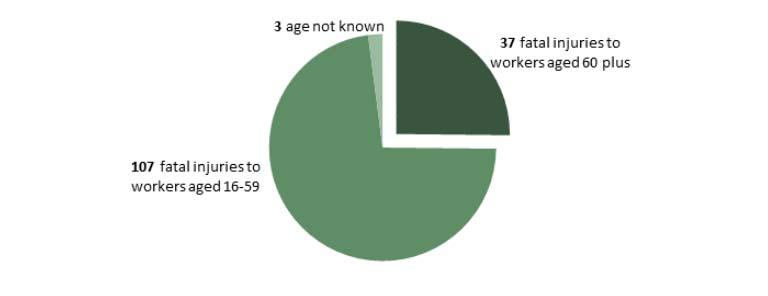
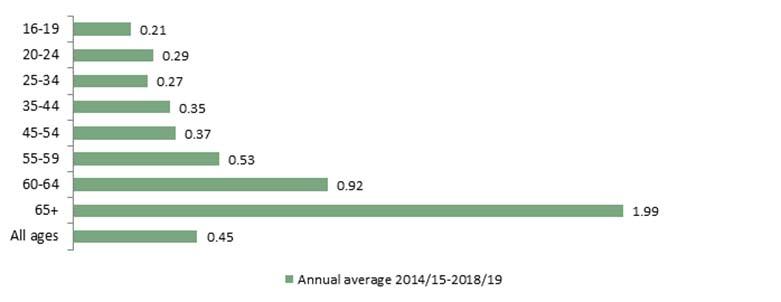
Figure 6 below shows the fatal injury rate by age group for the period 2014/15-2018/19. This clearly shows how the rate of fatal injury increases with age, with workers aged 60-64 having a rate around twice as high as the all ages rate, and workers aged 65 and over a rate more than four times as high as the all ages rate. Almost all the main industry sectors show an age gradient in fatal injury rate.
Injuries by employment status
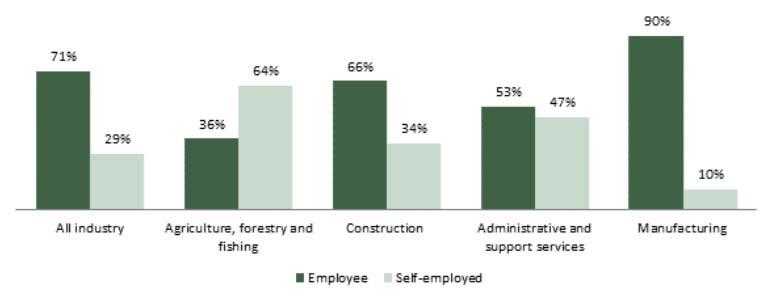
Over a quarter of fatal injuries in both 2018/19 and the five year-period 2014/15-2018/19, were to self employed
workers working mostly in Agriculture, forestry and fishing and Construction but also in other sectors including (but not restricted to) Manufacturing, and Administrative and support service activities (such as renting and leasing activities and services to buildings and landscape activities).
By industry, the proportion of fatal injuries to employees and the self-employed varies considerably, to some extent reflecting the relative make-up of the working population between employees and self-employed.
Figure 7: Fatal injury by employment status for selected industries, 2014/15-2018/19
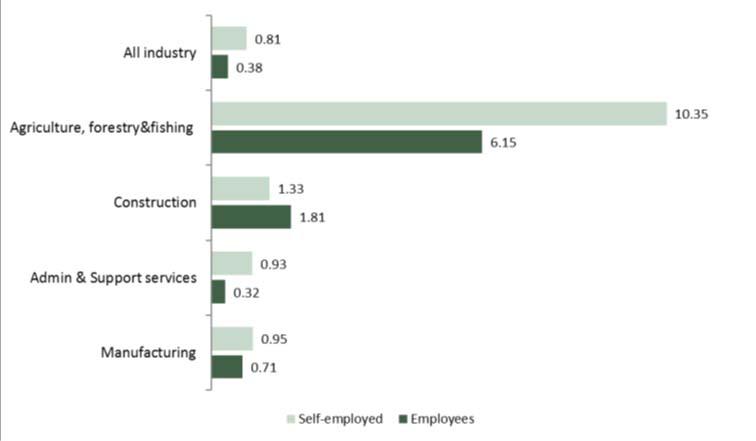
However, some of the difference in the proportion of fatal injuries to the self-employed by industry is due to variations in the rate of fatal injury to these workers. Overall, the fatal injury rate for the self-employed is more than double that for employees. This increased rate for self-employed workers is seen particularly in the Agriculture, forestry and fishing sector and Administration and Support service activities. However, in construction and manufacturing, there is more parity in the rate of fatal injury between employees and self-employed workers.
Figure 8: Rate of fatal injuries to employees and self-employed workers (per 100,000 workers) for selected industries, 2014/15 – 2018/19
Fatal injuries to members of the public
A total of 92 members of the public were killed in 2018/19 as a result of a work-connected accident. Of these deaths, about a third (32) occurred on railways and a further 23 occurred in the Health and social work sector.
Comparison of numbers between years is complicated by recent changes in reporting requirements. Since October 2013, the requirement to report suicides to members of the public on railways (which accounted for a high proportion of railway deaths) was removed. Further, since 2015/16, the fatality figure no longer includes ‘patient and service users’ deaths in England for premises registered with the Care Quality Commission. Previously these statistics were recorded as member of the public deaths in Health and social care.
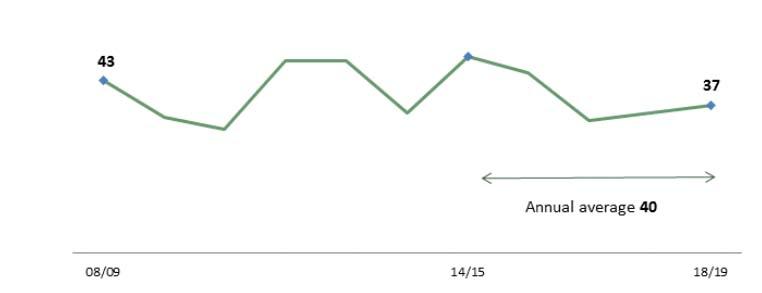
To get an indication of changes in work-related deaths to members of the public, the chart below considers work-related deaths to members of the public excluding those that occurred on railways and in health and social care. This shows that over the last decade the number of such deaths has fluctuated each year, with no clear trend.
Figure 13: Number of work-related deaths to member of the public, excluding deaths on railways and in health and social care: GB 2008/09 – 2018/19
If you would like any further help or support, please please contact us by phone 01458 253682, email or via our Facebook page or by Twitter.
Taunton & Somerset CPD Group at The Exchange House Taunton
Please remember that we now run these CPD events at the Exchange House, 12 – 14 The Crescent, Taunton TA1 4EB on a fortnightly basis
The next of the CPD events is listed below.
As previously requested, if you could let us know whether or not you can attend it would be greatly appreciated. Also, if you would like to give a talk, or know of somebody who would, please contact Jon at [email protected]
If you are not on the CPD Seminar mailing list but would like to be please drop Jon an email and he will deal with your request.
Please Note: These will commence again from 11th September
Below is the list of the 37 e-courses that have gone live:
- Accident Investigation Interactive
- Anti-Money Laundering
- Anti-Bribery
- Articulated Forklift Truck Operations
- Asbestos Awareness Interactive
- Child Safeguarding
- COSHH Interactive
- Display Screen Equipment Interactive
- Driver Safety Interactive
- DSE Workstation Assessment
- Electrical Safety
- Environmental Awareness Interactive
- Equality and Diversity
- Fire Extinguisher
- Fire Safety Interactive
- Fire Warden Interactive Training
- First Aid
- Food Hygiene
- Food Hygiene Level 2
- General Data Protection Regulations (GDPR)
- Health and Safety Induction Interactive
- Home Worker
- Infection Prevention and Control Interactive
- Information Security
- Lone Working Interactive
- Manual Handling Interactive
- Mental Health and Wellbeing Interactive
- Office Safety Interactive
- Permit To Work
- Personal Protective Equipment
- Protection Against the Effects of Noise
- Risk Assessment
- Safety Hazards
- Slips Trips and Falls Interactive
- Stress in the Workplace
- Working at Height Interactive
- Working with Disability in the Workplace
You can book as many of each of the courses as you need. We think our courses offer great value for money but to help you further, the more places you book on a course, the cheaper it becomes!
Simply click on any of the courses listed to find out what the course will offer you. if you like what you see, you can book the course online and we will send you individual logins for everyone undertaking the training. On successful completion of the course, certificates will be issued.
For more information and to book your course/s please go to: https://wilkinssafety.co.uk/courses/
We hope you find these useful and we will be adding new courses in the near future.
Why use online health and safety e-learning?
There are many e-learning benefits: You can drastically cut your risks and improve effectiveness. Staff retention and productivity will increase and safety will improve. It’s that simple.
The health and safety e-learning training courses are dynamic, engaging and very interesting. As the content is interactive your staff will learn quickly, retain more knowledge and enjoy the training.
The self test section means that they get to see how much they have learnt and if necessary, revisit any areas that they have failed. There is an option to print a certificate for each user who has passed which is personalised with their details.
By providing high quality accurate health and safety information to your staff you will build a culture of safety and help increase staff retention, productivity as well as protecting yourself from damaging and expensive legal action.
One of the major e-learning benefits is the fact that the system provides an audit trail which tracks your staff progress and you can make an accurate assessment of their understanding.
How is the training delivered?
The Wilkins Safety Group e-learning system is delivered over the Internet, all you need to access your system is a PC with Internet browser (you will also need your user name and password).
The system is hosted on our secure server. The server carries an SSL certificate and all data is encrypted for maximum security. We manage the server that means that you have no IT worries.
Purchasing Training Credits
If you are a company that will need quite a few of your staff trained using these courses, you may want to take advantage of the fact that you can pre-buy the training credits at a bulk rate. This will allow you to buy the credits at a discounted rate to be used at your convenience. There is no limit on the time it takes to use the credits and 1 credit = 1 training course.
For companies that know they will need over 5 in a year but not all at the same time this automatically starts reducing your costs.
To buy in bulk simply click on the “Training Credit Purchase” button and purchase the number you will require. Once you have paid for your courses you can utilise them at your leisure and fit them into your staff training requirements.
We are also talking with The British Safety Council to be able to offer their Level 1 and Level 2 courses on line, such as “The Level 1 Health & Safety in a Construction Environment” and “Level 2 Principles of Risk Assessment” So watch this space!
