The total number of working days lost due to work related stress, depression or anxiety was 11.3 million in 2013/14, an average of 23 days per case of stress, depression or anxiety.
The HSE have just released the latest Labour Force Survey figures about work related stress and they make interesting reading.
Stress at work is a major issue, if you want to see how big, see the statistics, but you can successfully manage and prevent it.
The Wilkins Safety Group can help you prevent work related stress and comply with the law.
This week’s 2 recent HSE cases both look at serious accidents that shouldn’t have happened.
- Mr Hoskin, who was 49-years-old at the time of his death, was employed to fix holes in the crematorium roof with the help of a Cremtor employee.
- Mark Marshall, 19, had his hand and much of his forearm was severed and it was later reduced further during surgery. He will also need a further operation.
As ever, if you have a subject that you would like us to cover one week, please contact us by phone 01458 253682, Email, or via our Facebook page, or by Twitter.
Work-related stress – is your workplace at risk?
The information in this article relates to Health and Safety statistics for 2013/14. The document can be found here.
Summary
- The total number of cases of work-related stress, depression or anxiety in 2013/14 was 487 000 cases (39%) out of a total of 1 241 000 cases for all work-related illnesses.
- The number of new cases of work-related stress, depression or anxiety in 2013/14 was 244 000.
- The rates of work-related stress, depression or anxiety, for both total and new cases, have remained broadly flat for more than a decade.
- The total number of working days lost due to work-related stress, depression or anxiety was 11.3 million in 2013/14, an average of 23 days per case of stress, depression or anxiety.
- The industries that reported the highest prevalence rates of work-related stress, depression or anxiety (three-year average) were human health and social work, education and public administration and defence.
- The occupations that reported the highest prevalence rates of work-related stress, depression or anxiety (three-year average) were health professionals (in particular nurses), teaching and educational professionals, and health and social care associate professionals (in particular welfare and housing associate professionals).
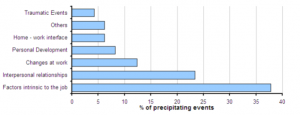
The main work activities suggested as causing work-related stress depression or anxiety reported to general practitioners are:
- Workload pressures including scheduling, shift work and other organisational factors;
- Interpersonal relationships including difficulties with superiors and bullying or harassment; and
- Changes at work including reduction of resource or staff and additional responsibilities.
So what is Work related Stress?
Work-related stress is defined as a harmful reaction that people have to undue pressures and demands placed on them at work. By its very nature, stress is difficult to measure and HSE have two different data sources from which to conduct analysis. The preferred data source used by HSE for calculating rates and estimates for stress, depression or anxiety (referred to as stress hereafter) is the Labour Force Survey (LFS).
The LFS is a household survey consisting of around 44 000 households across Great Britain which provides information about the labour market. HSE commissions a module of questions in the LFS to gain a view of work-related illness based on individuals’ perceptions.
The LFS provides national estimates and corresponding rates of the overall prevalence (total cases) of self-reported work-related illness during the previous 12 months, which includes long standing as well as new cases, of incidence (new cases) of work-related illness in the same period and of annual working days lost due to work-related illness. Estimates and rates relate to people working in the previous 12 months. Statistics presented in this document are based on the LFS data, unless otherwise specified.
In addition to the LFS, HSE also collects data on work-related stress through the Health and Occupation Research network for general practitioners (THOR-GP) across Great Britain. This network asks reporting general practitioners to assess whether new cases of mental ill health presented in their surgeries are work-related, and if so, what was the work-related cause of this disorder. The two data sources may reflect different perceptions of work related attribution to individual cases.
Industry and Occupation
The industries with the highest estimated prevalence rate of work-related stress in GB averaged over the last three years (2010/11, 2011/12 and 2013/14) were as follows;
Human health and social work activities with 2 060 cases per 100 000 people working in the last 12 months, Education with 1 720 cases per 100 000 people, and public administration and defence with 2 030 cases per 100 000 people working in the last 12 months.
These industries have statistically significantly higher estimated prevalence rates of work-related stress than across all industries averaged over 2010/11, 2011/12 and 2013/14.
When comparing the estimated prevalence rates of work-related stress in these three industry areas with the average of the previous three year period (2007/08-2009/10) there has been no statistical significant change.
The occupations with the highest estimated prevalence rate of work-related stress in GB, averaged over the last three years (2010/11, 2011/12 and 2013/14) were as follows;
Welfare and housing associate professionals with 2 830 cases per 100 000 people working in the last 12 months, Nurses with 2 630 cases per 100 000 people, teaching and education professionals with 2 310 cases per 100 000 people, administrative occupations: government and related organisations with 2 310 per 100 000 people and customer service occupations with 2 160 cases per 100 000 people working in the last 12 months.
These occupations have statistically significantly higher estimated prevalence rates of work-related stress than across all occupations averaged over 2010/11, 2011/12 and 2013/14.
When comparing the estimated prevalence rate of work-related stress for these occupations with the average of the previous three year period (2007/08 – 2009/10), there has been no statistical significant change.
Age and Gender distribution
In 2013/14 there was an estimated prevalence of 221 000 male and 266 000 female cases of work-related stress and an estimated incidence of 115 000 male and 128 000 female cases.
Female prevalence and incidence rates have remained statistically significantly higher than corresponding male rates over time.
Males had a statistically significantly higher estimated incidence rate in 2013/14 compared to 2011/12. There was no statistical significant difference in the incidence rate between females in 2013/14 and 2011/12
Females had a statistically significantly lower incidence rate in 2013/14 compared to 2001/02. There was no significant difference in the incidence rate for males between 2013/14 and 2001/02.
The 45-54 age group had the highest incidence rate for all persons, and this rate was statistically significantly higher than the average for all persons. This was also the case for females in the 45-54 age group.
Size of Workplace
Small workplaces (<50 employees) had the lowest prevalence rate of stress with an estimated 1 070 cases per 100 000 people, followed by medium workplaces (50-249 employees) estimated at 1 560 cases per 100 000 people and the highest rate was amongst large workplaces (250+ employees) with an estimated 1 730 cases per 100 000 in 2013/14.
In 2013/14, the prevalence rate for both medium and large workplaces was statistically significantly higher than the rate for small workplaces.
The rate for medium businesses was statistically significantly higher in 2013/14 compared to 2011/12.
The self-employed on own or with partners but no employees consistently show a statistically significantly lower prevalence rate of stress (650 per 100 000 workers in 2013/14) compared to the average across all persons.
In 2013/14, small businesses lost, on average, 0.27 days per worker due to stress in the workplace. Medium and large workplaces had statistically significantly higher number of working days lost per worker compared to small businesses with 0.46 and 0.56 average days lost per worker, respectively.
Causes of stress
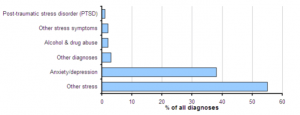
The main causes of work-related stress are examined from the general practitioners reporting network (THOR-GP) sponsored by HSE.
Participating GPs are requested to return specific information on new cases of occupational ill health that they see in their clinical practice, and on related sickness absence. Data is collected on symptoms or diagnosis, occupation, industry and work-related causes.
Figure 1 –
Working days lost
Work-related stress caused workers in Great Britain to lose 11.3 million working days in 2013/14 based on the LFS data. Male workers accounted for an estimated 5.4 million days off work whilst female workers accounted for an estimated 5.9 million. This represents a decrease in annual working days lost since 2001/02, when it was 12.9 million days in total.
On average, each person suffering from this condition took 23 days off work. This is one of the highest average days lost per case figure amongst the recognised health complaints covered in the LFS.
Both medium and large sized workplaces were estimated to have statistically significantly higher days lost per worker than small workplaces in 2013/14. Only medium businesses had a statistically significantly higher rate in 2013/14 compared to 2011/12.
The estimated average number of days sickness absence per case due to mental ill health under THOR-GP between 2011 and 2013 was 39 days per case. This represented 59% of the total days certified sickness absence.
If you have any questions about these statistics, or would like to see what you can do to improve things at your place of work, please contact us by phone 01458 253682 or Email.
Our CDM2015 courses have been given APS validation! 
 As we announced the other week our CDM2015 Awareness course is now an Accredited Course and any individual who successfully completes it may claim points towards membership of the Association for Project Safety. They will also receive an APS Certificate.
We have run three courses over the last week for The National Trust at venues in Styal, Cheshire, Lacock Abbey, Wiltshire and Grosvenor Gardens in London. These have all been well received and have answered many questions!
All of our three course dates at Taunton Racecourse are Sold Out!
However we are also looking to run this course in the Bristol, Bath, Exeter areas as well as Dorset and have been asked to run it in London and Leicester.
So look out for the dates!!
Let us know if you would like it run in your area or “In House”
Other courses Coming soon!
As well as the CDM2015 course we have been asked about
- Fire Warden Courses
- Health and Safety for SME Owners
- First Aid Training
- Construction Site Safety Awareness
So we are arranging dates for these and other courses, over the next few months
If you have any questions about these courses or any other training or would like us to run a particular course for you, call Jon Wilkins of the Wilkins Safety Group on 01458 253682 or email him.


